 University Project · Logistic Simulation Lab
Automating Ravenna's Port with AGVs: A Simulation in AutoMod
Our final project for Logistic Simulation Lab. We modelled the container terminal of Ravenna's port, where containers are still moved by manual internal transport, and automated it with a fleet of ten AGVs and four cranes, using real distances and a 500-container input file.
In short
- Problem
- Inside Ravenna's port, containers are still moved from ship to yard to storage by manual internal transport.
- Approach
- A model of the real terminal, built with measured distances and fed by a 500-container input file, where a fleet of 10 AGVs and 4 cranes take over the handling.
- Result
- All 500 containers were off the simulated ship by hour 9, and delivering took the largest share of the AGVs' time (44.2%), which we read as a well-sized fleet.
- Tools
- AutoMod
This was our final project for the Logistic Simulation Lab course at the Università di Bologna, built together with my friend and classmate Luca Naldi. We picked the port of Ravenna because inside the terminal containers are still moved by manual internal transport, and we wanted to see how that job would go if a fleet of automated guided vehicles (AGVs) took it over.
We built and ran everything in AutoMod™, a discrete-event simulation package. You describe the physical layout (paths, queues, machines) and the logic that moves things through it, then let simulated time run and read the statistics.
The problemLink to this section
Ravenna is a canal port: its terminals line the Candiano canal, between the city and the Adriatic. Container traffic is heavy: the port's traffic report for April 2025 counts 72,177 TEU between January and April 2025, over 148 container-ship calls. Inside the port, those boxes have to be moved between the ships, the yard and the storage areas where the trains arrive.
Our goal was to raise the level of automation of that internal handling. We added a fleet of AGVs to make container handling faster, then checked whether the fleet we picked could keep up without the vehicles getting in each other's way.
Where the data comes fromLink to this section
We wanted the model as close to the real port as we could get it. We measured the distances and dimensions of the roads and storage areas, and took the rest of the data from the official website of the port of Ravenna. For the central yard, we took its real footprint and divided it by the footprint of one container, which gave a capacity of 1,746 containers.
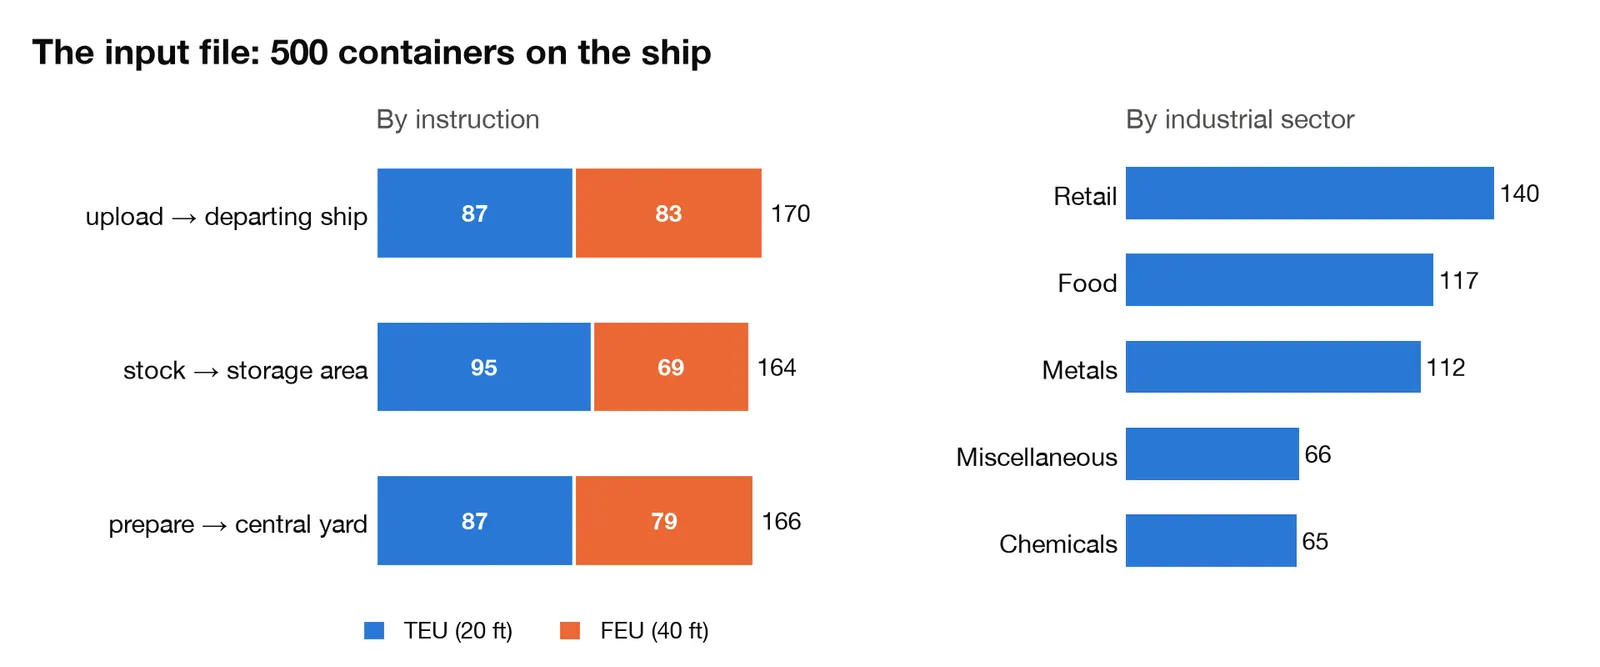
For the cargo, we wrote an input file, INDATA.csv, that works like the manifest of an arriving ship: one line per container, 500 in all. Each line has three fields:
- size: TEU (a standard 20-foot container) or FEU (a 40-foot one);
- instruction: what has to happen to it once it is off the ship.
uploadsends it straight to the ship that is being loaded,stocksends it to a storage area,preparesends it to the central yard as temporary storage, for containers whose destination is still uncertain; - sector: the industry it belongs to (Food, Chemicals, Metals, Retail or Miscellaneous), so that we could monitor which sector moves the most containers.
The model: three zonesLink to this section
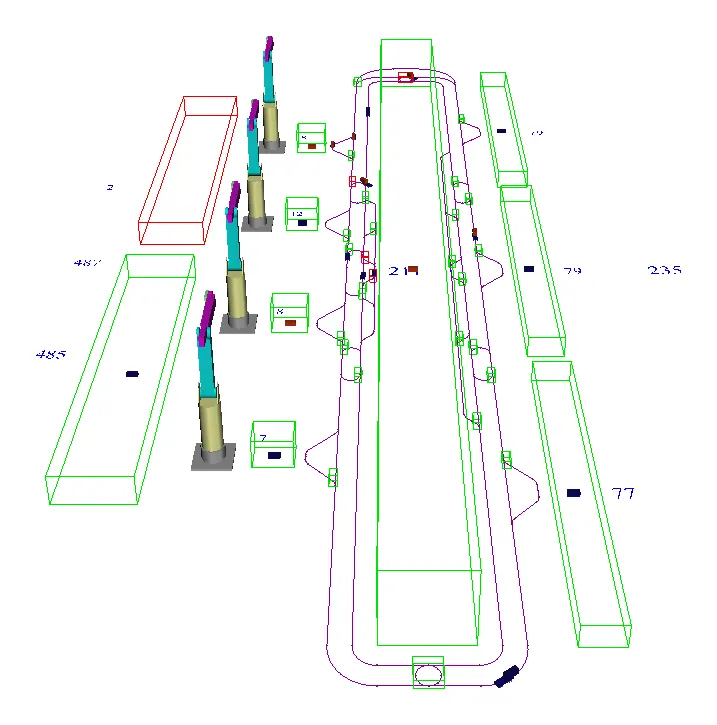
The terminal has three zones, and the AGVs connect them.
The ships. Two queues called Q_ship stand for two ships, one waiting to be loaded and one waiting to be unloaded. Four cranes do the lifting, two per ship. Each crane has a small buffer queue (Q_crane, 50 containers) where it puts down the boxes it unloads and picks up the ones it has to load, so a short delay elsewhere in the system does not stop the crane until its buffer is full.
The central yard. One big queue, Q_send, with room for 1,746 containers. It holds the containers that are already in the port when the simulation starts, waiting to be stored or loaded on a ship, and it doubles as a temporary yard for containers whose destination is still uncertain. Because it is so long, the AGVs can reach it from six control points, three on each side, so that they do not queue up behind each other waiting to pick up or drop off.
The storage areas. Three queues called Q_stock, 550 containers each. This is where the trains arrive, so this zone also brings new containers into the system: a train arrives every 3 to 8 hours (triangular distribution, most likely 5) and its containers are then sorted by the AGVs according to their destination. The real port has more than three storage areas; we had to cut them to three because the software limits the number of entities you can build.
The fleet is 10 AGVs on a guide path that runs around the central yard. In the model the straight lanes along the yard are about 580 m long, and the vehicle template has a top speed of 4.5 m/s. AGVs pick up and drop off only at control points: one at each crane, six along the yard, one per storage area, plus a parking spot on a secondary road, out of the way of the main lanes. Wherever two lanes meet, a block lets only one vehicle through at a time, so they cannot collide at the junctions.
From a port to AutoMod entitiesLink to this section
For a reader who has never opened AutoMod: the software gives you a fixed set of building blocks, and most of the modelling work is deciding which real thing becomes which block.
| In the real port | In AutoMod | In our model |
|---|---|---|
| A container | Load, with attributes | Each container carries its size, instruction and sector. L_container creates the 400 already in the port, L_arrival the ones brought by trains, L_dummy_container reads the input file and clones itself into the 500 on the ship. |
| A crane | Resource | R_crane, 4 units. Each lift takes between 90 and 150 seconds (triangular, most likely 120). |
| Ship, crane buffer, yard, storage area | Queue | Q_ship (2), Q_crane (4), Q_send (1), Q_stock (3), each with its own capacity. |
| Working in batches | Order list | OL_upload and OL_unload hold containers until there are ten, then release them to the crane together. |
| What happens to a container, step by step | Process | P_unload, P_upload, P_send, P_stock, plus P_start and P_stock_arrival that create containers with random attributes. |
| The AGV fleet | Path mover system | 10 vehicles, the guide path, the control points and the lists that tell idle vehicles where to go. |
| Junctions | Block | One block with 28 instances, one at each junction where two vehicles could collide. |
| Counters and KPIs | Variables and labels | Live counters on screen, plus totals per flow, per size and per sector. |
We wrote the processes to be as vectorial as possible. Instead of one process per crane, there is one process with several copies, and the index of the copy (procindex in AutoMod's language) tells it which crane, ship or storage area it is working on. That kept the code short. This is the core of the loading process:
inc V_load(procindex) by 1
if V_load(procindex) = 10 begin
    order 10 loads from OL_upload(procindex)
    in case order not filled backorder on OL_upload(procindex)
    set V_load(procindex) to 0
end
wait to be ordered on OL_upload(procindex)
use R_crane(procindex) for triangular 90, 120, 150
move into Q_ship(1)
Every container that reaches a crane adds one to a counter and waits on the order list. When the counter hits ten, the batch is released, the crane lifts each container (90 to 150 s) and it ends up on the ship.
Three lists steer the AGVs. The named list decides where they appear at the start (the parking spot). The park list tells an idle vehicle with nothing left to do to go back to the parking spot. The work lists tell a vehicle that has just dropped a container which control points to check next for a waiting load.
A dedicated load called L_print writes the KPIs to an output file: first after 8 simulated hours, then every hour. For each flow (unloaded from the ship, taken out of storage, stocked, loaded onto the ship) it writes how many containers have been handled so far.
ResultsLink to this section
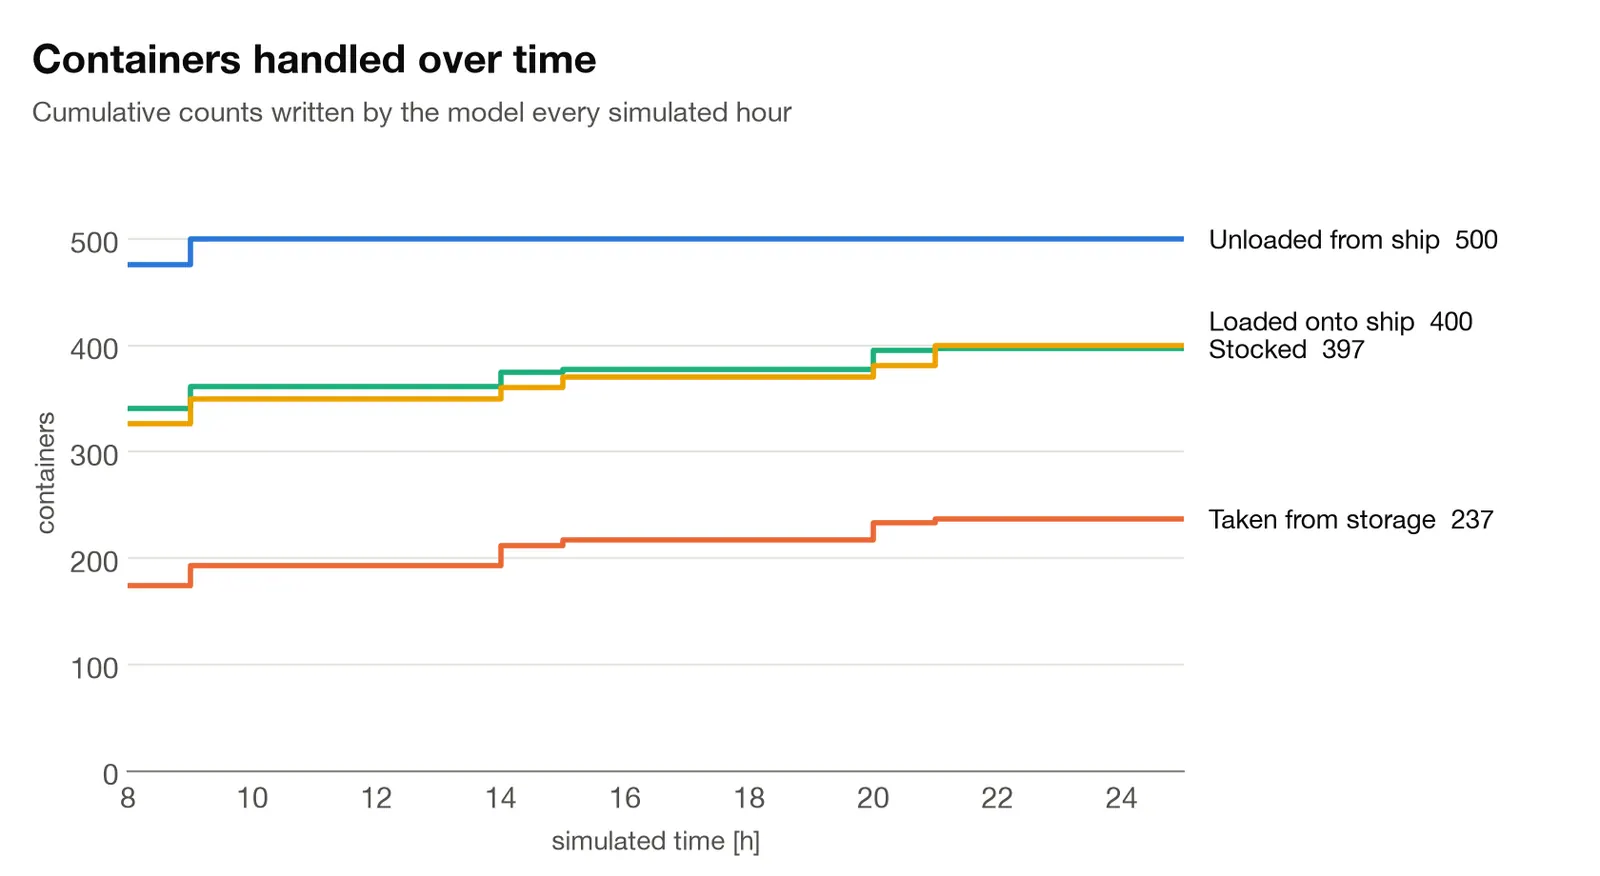
By hour 8, 476 of the 500 containers on the ship were already off; by hour 9 all 500 were. At hour 25 the model had handled 1,534 operations in total. A container that is unloaded and then loaded onto the other ship counts once in each flow, so this is a count of handling operations, not of distinct containers.
| Flow (at hour 25) | Containers |
|---|---|
| Unloaded from the ship | 500 |
| Taken out of storage | 237 |
| Stocked | 397 |
| Loaded onto the ship | 400 |
| Total operations | 1,534 |
The AGV fleetLink to this section
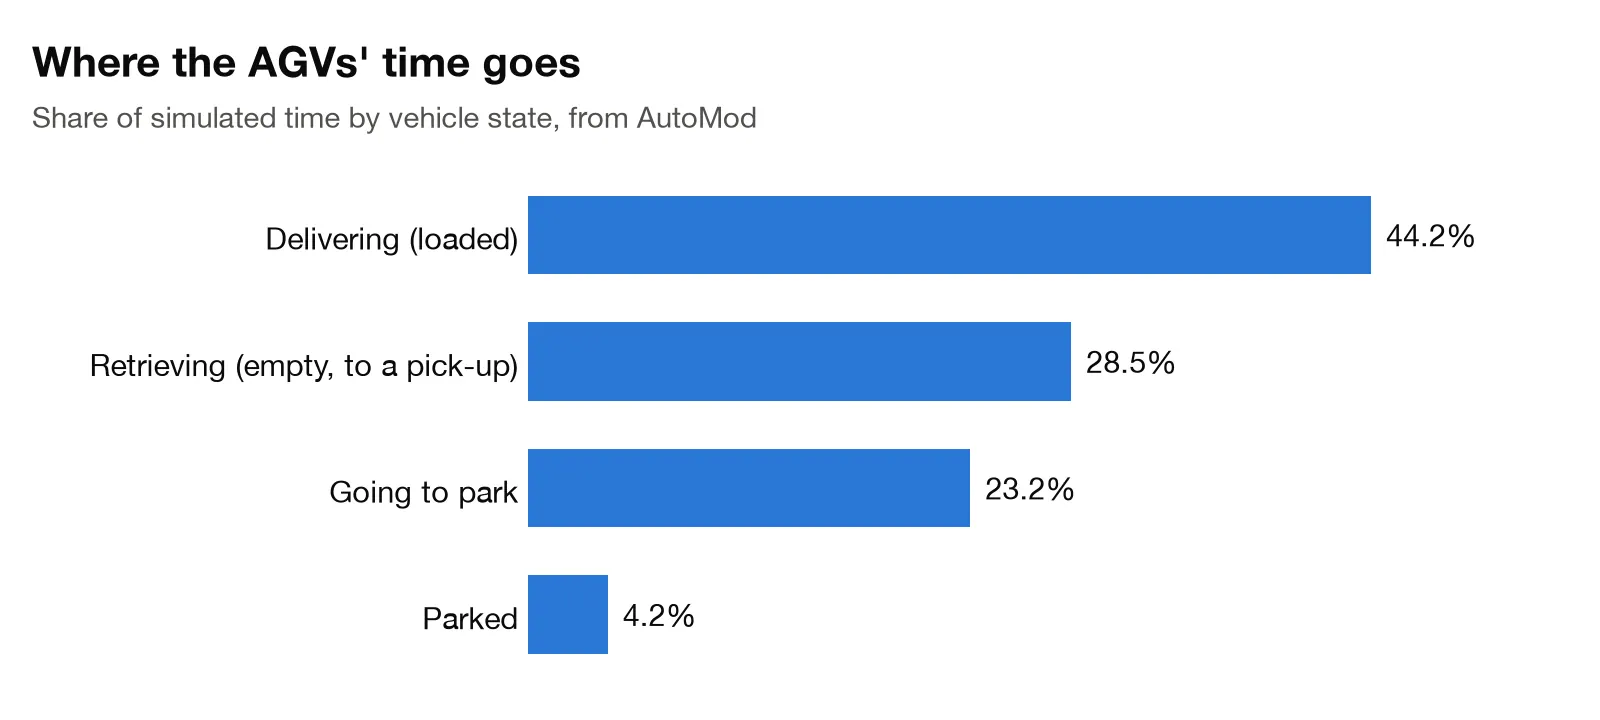
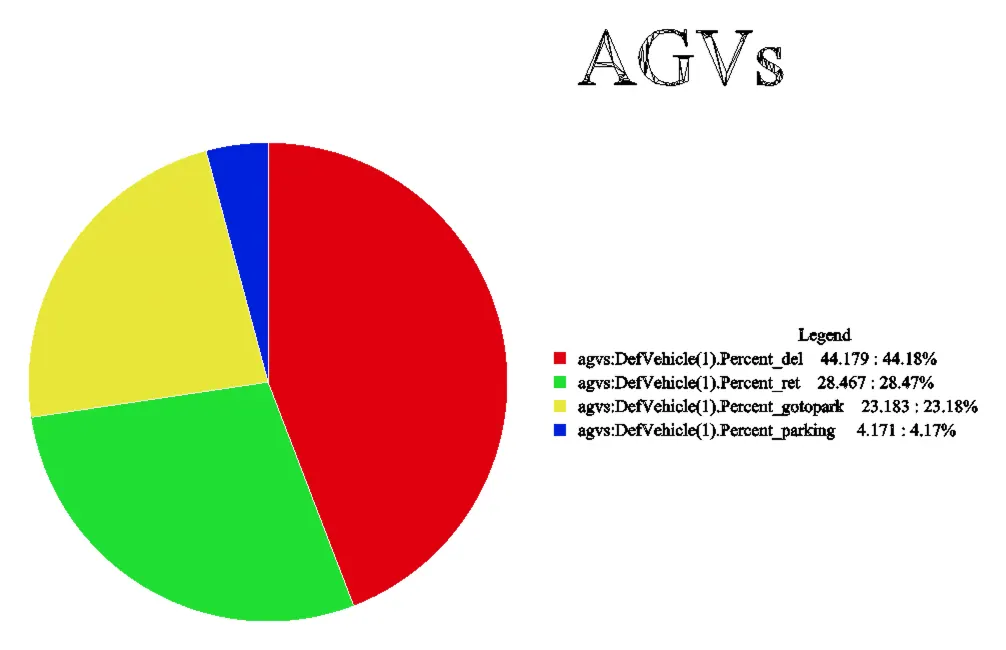
This chart tells you whether the fleet is the right size. Delivering takes the largest share of the time (44.2%), so the vehicles spend more time carrying containers than doing anything else. Retrieving, the empty trip to the next pick-up, takes 28.5%. Going to park takes 23.2%, which is a lot; our guess is that an AGV gets that instruction while it waits to be assigned a new load. Time spent parked is only 4.2%, and that phase is still needed: it is when an AGV can recharge, and it keeps idle vehicles off the lanes where they would block the others. Overall, the fleet looks well balanced: ten AGVs are enough to handle the container flow, without so many that they spend their time parked.
What moved through the terminalLink to this section
AutoMod also drew three business graphics, which went into our report: containers by industrial sector, AGV time by state (the same data as the chart above), and containers by size.
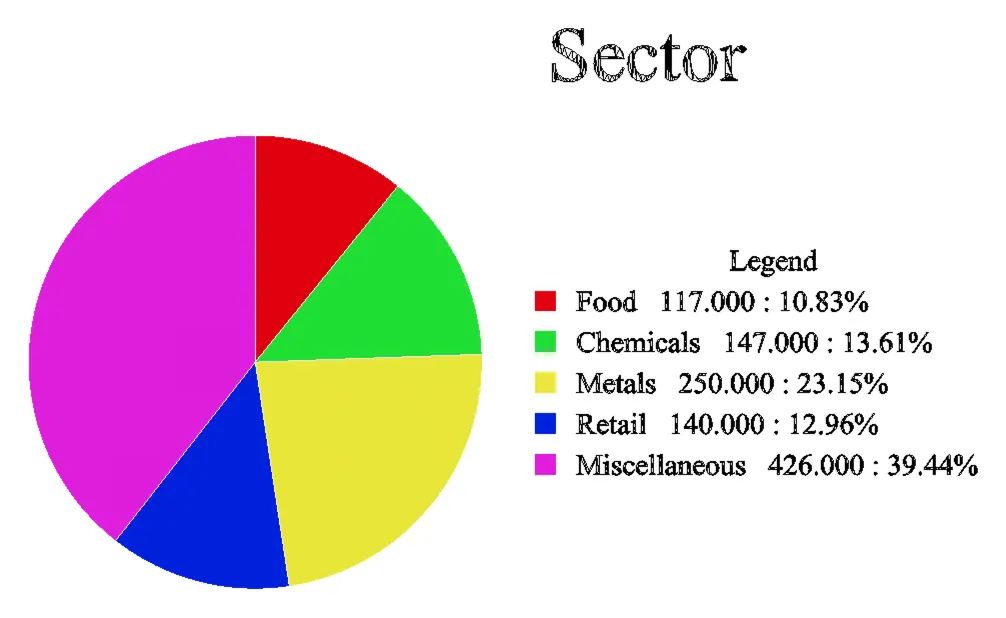
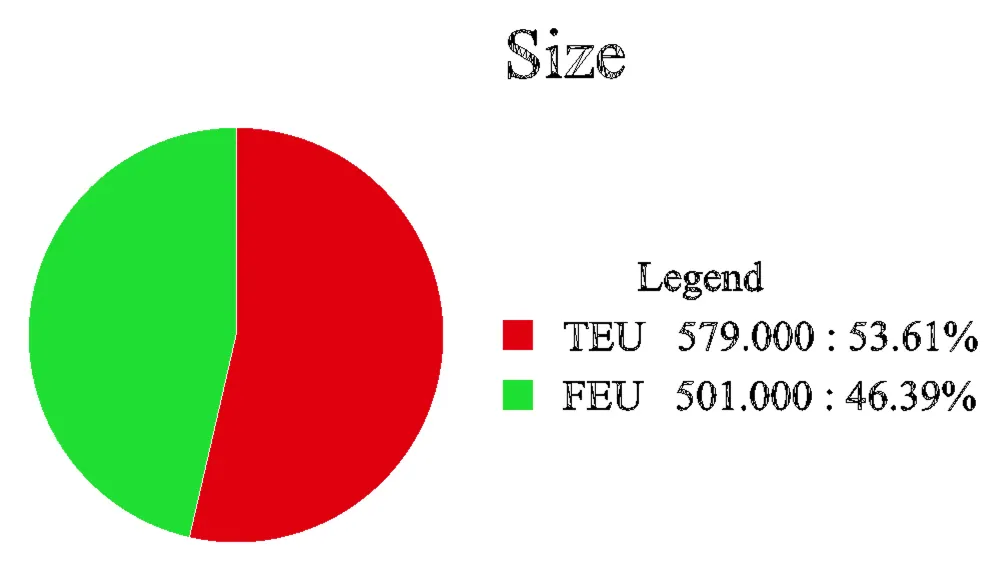
We built the sector chart to see which industries rely most on the terminal and how much each product category adds to its workload. The size chart shows that just over half the containers handled (53.61%) were TEU. Knowing the split between 20-foot and 40-foot boxes helps estimate the tonnage the system moves.
LimitsLink to this section
The model simplifies the real port in a few places:
- Delays in train or ship arrivals are not included.
- The real port is larger and more complex. The storage areas in particular were cut to three because of the entity limit.
- The trains are not modelled as vehicles, only as the containers they bring, again because of the entity limit.
- We represented the four ship cranes with AutoMod's robotic-arm model, which cannot move.
- The central yard is a queue. In the real port, moving containers around inside it would take a mobile crane.